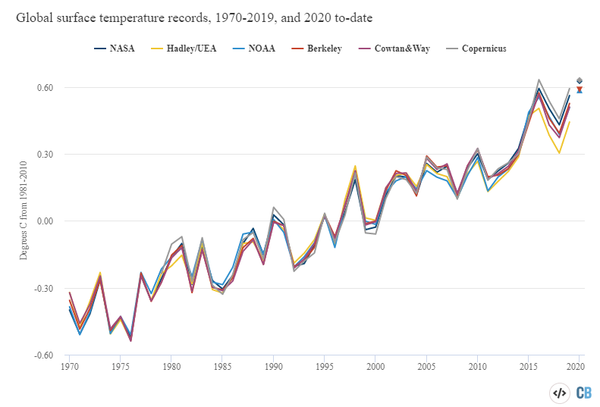
The CarbonBrief report used data from NASA, the US National Oceanic and Atmospheric Administration, the Met Office Hadley Center, Berkeley Earth, Cowtan and Way and the EU’s Copernicus Climate Change Service.
Data from each organization was compiled into a graph detailing the annual global mean surface temperatures for each year since 1970, including the first nine months of 2020.

“Surface temperature records have shown around 0.9C warming since the year 1970, a warming rate of about 0.18C per decade,” the report detailed, highlighting that many months in 2020 “have set new temperature records.”
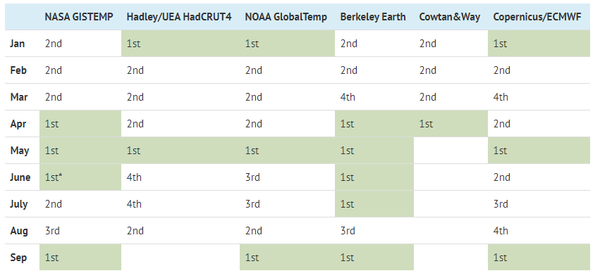
At least one data set on global surface temperature reported record temperatures in this year’s months of January, April, May, June, July and September. No month in 2020 has been listed lower than the fourth warmest of its kind on record.

“It is likely that a growing La Niña event in the tropical Pacific will modestly depress temperatures in the next few months, but its main effect will be felt in 2021, as global temperatures tend to lag behind those in the El Niño region of the Pacific by around three months,” the report explained.
Scientists predicted that the impacts of such events could bring Earth cooler surface temperatures in 2021 than those of 2020.
The analysis also concluded that greenhouse gas concentrations have “reached a new high in 2020, driven by human emissions from fossil fuels, land use and agriculture.”
It highlighted that CO2, methane (CH4) and nitrous oxide (N2O) are the top three greenhouse gases responsible for the majority of “additional heat trapped by human activities.”
“CO2 is by far the largest factor, accounting for roughly 50% of the increase in “radiative forcing” since the year 1750,” the report read. “The remaining 16% comes from other factors including carbon monoxide, black carbon and halocarbons, such as [chlorofluorocarbons].”
The first nine months of 2020 demonstrated record concentrations of CO2, CH4 and N2O in the atmosphere.


